Politics July 5, 2018
Do protesters vote?
With millions of protesters participating in the 2018 Women’s March and March for Our Lives, some members of the Democratic Party believe they have found a silver lining to Trump’s ascension to the Oval Office. While lack of voter participation lost Hillary Clinton the presidency in 2016, the consequential election of Trump seems to have renewed political participation from the left.
Or has it?
Results from the early 2018 primaries, especially from California, may prove the prediction of heightened voter participation wrong. LA Times reporter Steve Lopez spoke to California residents and their decisions to vote in the June 6 primary election. He found significant indifference to voting participation, although some residents explained their indifference did not extend to politics overall.
Let’s break down voter participation in the 2018 California primary and determine whether this supposed blue wave is actually more of a ripple.
If these numbers look a little low, don’t worry! You’re probably used to statistics on registered voter turnout. This type of calculation determines voter participation by comparing the number of votes to the number of registered voters. For example, if 100 people register to vote for an election, and 40 of those registered voters actually vote, the registered voter turnout is 40%.
Eligible voter participation compares the number of votes to the number of eligible voters. Eligible voters include any person that could legally register to vote. If a person is at least 18 years old, a resident of the state in which the election takes place, a U.S. citizen and (depending on the state) not currently a felon, they are eligible to vote. So if 100 people are eligible to vote in an election, and 20 of these people actually vote, the eligible voter turnout is 20%, regardless of how many people actually registered.
Eligible voter turnout percentages are lower than registered voter percentages because eligible voters are a larger group than registered voters. All registered voters are eligible to vote, but not all eligible voters are registered.
Eligible voter percentages may be less precise because the data on eligible voters is largely based on census estimates. While we cannot singularly count every single eligible voter in a state, we can calculate an estimation from a sample size. However, there is data on every registered voter in a state, so those numbers can be precisely counted.
While registered voter turnout statistics are more precise, eligible voter turnout statistics are more reliable in comparing data between years and between states. Voter registration can vary over time due to new technology, laws and methods. These factors also vary between states; for example, some states allow early voting, while others do not.
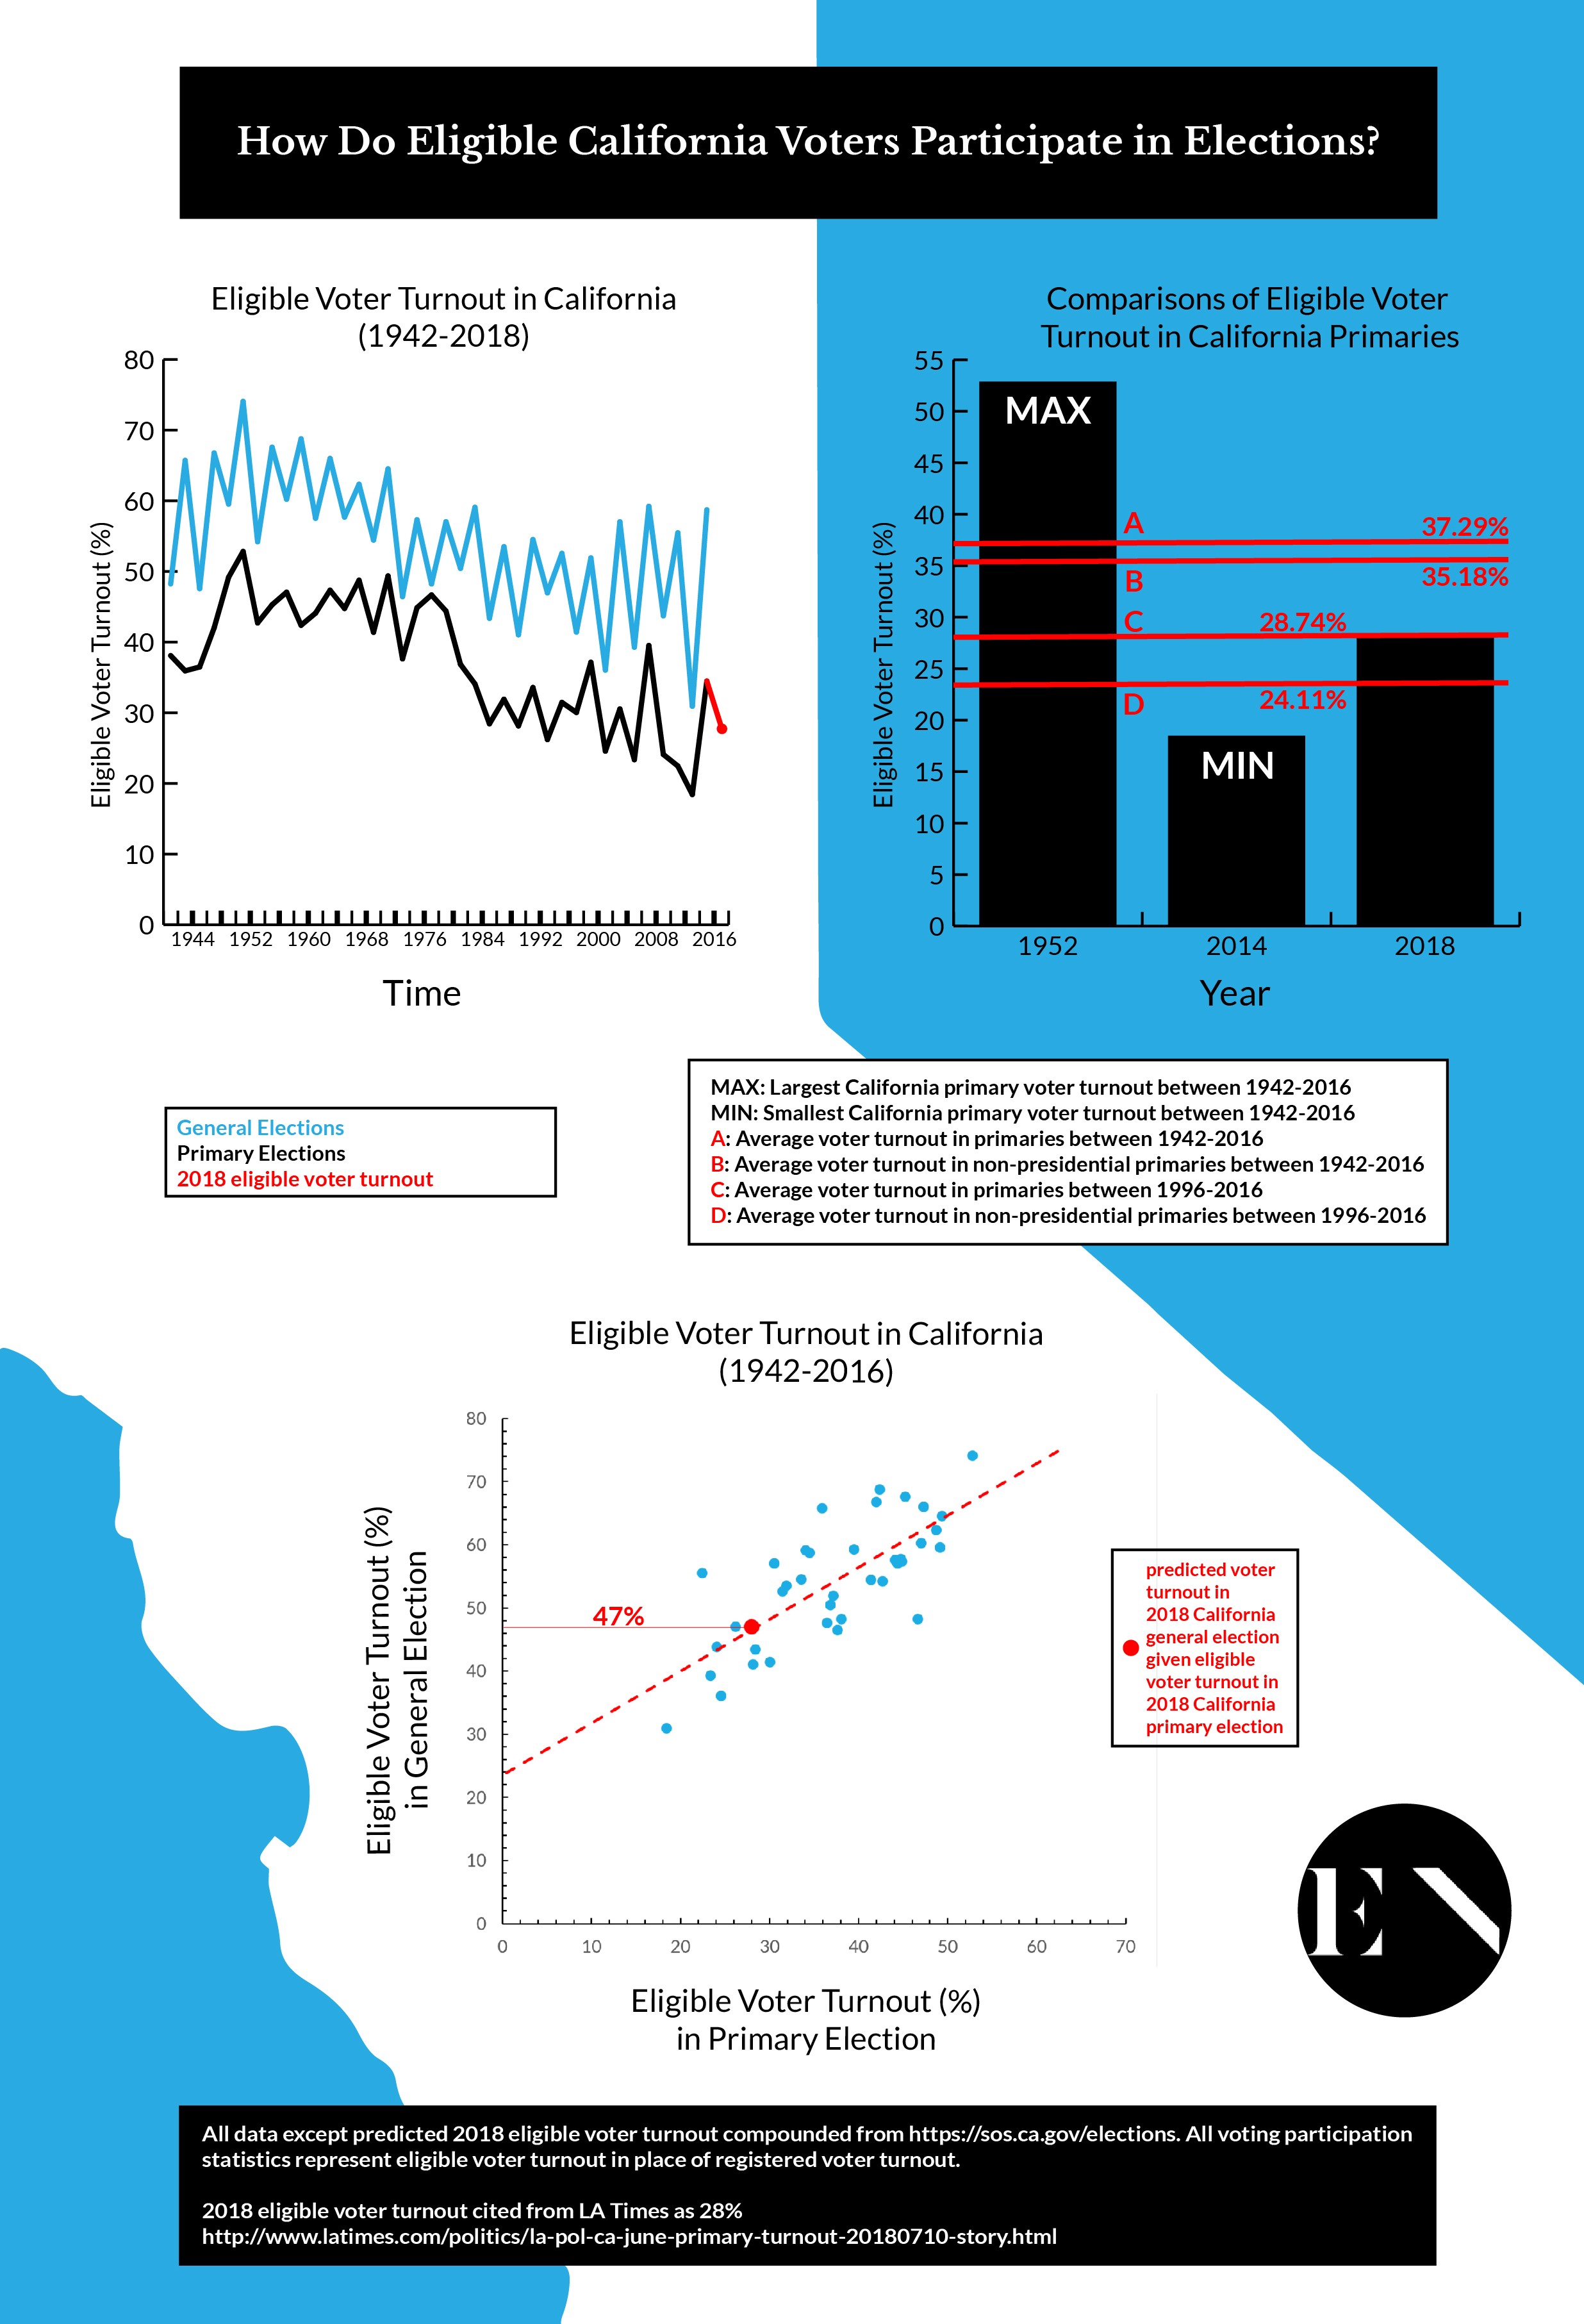
The easiest trend to catch is the amount of voter participation in primary elections and general elections. In every single year since 1942, there was a higher voter turnout in general elections than there were in the primaries.
This probably comes as common knowledge. Most Americans see the general election as much more important. After all, the primary merely narrows down the options; the general election actually chooses the winner.
We also see a trend in voter turnout over time. Since 1942, eligible voter turnout has dropped in California. In both general elections and primary elections, we see a significant downward shift in voter participation.
However, this data might not seem so obvious at first glance. We see spikes in voter turnout between the years. Voter participation in the 1942 general election is actually less than the turnout in 2016. And it’s also less than the turnouts in 2012, 2008 and 2004.
These years should sound familiar to you. (Trump. Obama. Bush.) General elections with presidential candidates on the ballot attract a much higher voter turnout than years without them. We have to take this into account when we look at the downward shift in voter participation. Compare all the tops of the spikes to each other. Then compare all the bottoms. Each group drops in value over time.
Voter participation doesn’t fluctuate so predictably in primary elections. For example, voter turnout actually goes down between the non-presidential primary in 2010 and the presidential primary in 2012.
This is likely due to the re-election of Obama as the primary Democratic candidate. If a president serving a first term wants to be re-elected, they are almost always the primary candidate for their party in the next election. It is likely that many Democratic voters in the 2012 primary opted out of voting due to the certainty that Barack Obama would be selected again as their candidate. As California is a largely blue state, the loss of these Democratic voters likely had a large impact on primary voter participation.
Our original estimate of 2018* eligible voter turnout (29.8%) was calculated from total ballots cast (6,483,525) along with estimated unprocessed ballots (936,701) and California’s 2017 eligible voter population (24.9 million). Since then, the LA Times has reported eligible voter turnout as 28%, so we have updated our information.
But let’s get back to the main question. Was voter participation in the 2018 primary really that apathetic?
There are many variables to consider. Voter turnout in the 2018 primary is less than the average primary turnout from 1942-2016. Although this average includes presidential primaries, we know that it is possible for presidential primaries (like in 2012) to have low voter turnout. If Trump truly inspired a revolution of political resistance, it may not be so unreasonable to expect a voter turnout close to the average.
However, the average primary turnout among non-presidential years since 1942 is less than the average primary turnout among all even years since 1942. Therefore, the non-presidential average is likely a better comparison.
But the 2018 primary voter turnout is still less than average voter participation from 1942-2016, even without presidential primary data. This can seem disappointing. Voter interest remains below average. If this was a school subject, 2018 California voters rank lower than a C.
We do know that voter turnout is lower nowadays than it used to be. If we take modern-day voting practices into account, how do 2018 primary voters do?
Narrowing the timeline to 1996-2016, 2018 primary voters rank well above a C. Among non-presidential primaries, 2018 voter turnout is actually the second largest since 1986.
Including presidential primaries changes the average eligible voter turnout, but that average is probably an unfair comparison to this non-presidential primary. So our judgment of 2018 voters largely depends on how we consider time. Limiting our time range changes the comparison between participation in the 2018 primary and average voter turnout.
2018 voter participation is below average voter turnout (including and not including presidential primaries) in the past 75 years, but it’s above average voter turnout (not including presidential primaries) in the past 20 years.
On one hand, maybe we should examine voter participation with as many controlled variables as possible. Comparing voter turnouts in the same time frame is the best way to determine change within a similar context. We know that 2018 voter participation is much larger than other non-presidential primaries in the past 20 years; this signifies a change from the downward trend.
On the other hand, maybe we don’t need such a small time frame to correctly assess the 2018 primary. Three decades isn’t that long ago. Voters in the late 1900s easily made it to the polls; if there truly is a political revolution against Trump, shooting for this sort of turnout is not unreasonable.
After all, it was done before. Why isn’t it done now?
Taking both perspectives into consideration, maybe the final analysis is this. Trump has created a shift in voter participation. There is hope of reversing the decreasing voter turnout of the twenty-first century. But it’s not a revolution.
Not yet, at least.
Using previous data on the relationship between primary and general elections (see scatter-plot of Eligible Voter Turnout 1942-2016), we can predict that the voter turnout in the 2018 general election will be 47% if voter turnout in the 2018 primary was 28%.
If voter turnout in the general election is largely above this number, it can suggest a few conclusions. The gap between primary and general election voter participation is larger than usual, meaning that these primaries, in particular, made a significantly low impact on potential voters despite increased political interest.
It could also suggest a change in voter mindsets between summer and fall. Whether it be increased media coverage, another event involving Trump or heightened political efforts from Trump resistance, registered voters might find themselves more affected than they were in the primaries.
As mentioned before, California is a very left-leaning state. It is possible that this political alignment either increases or decreases voter participation. I have heard liberal California residents say, “California doesn’t really need our votes, anyway.” However, liberals are also the most politically resistant to Trump, which increases the likelihood of their political participation.
Despite all these variables, California voter participation can still improve. It doesn’t matter that it’s a non-presidential election year or that we no longer live in the ’50s or that California is a majorly Democratic state. As Michelle Obama says: “elections aren’t just about who votes but who doesn’t vote.”
See you at the polls!